Hi, I'm Jason
I'm an experienced Software Engineer && UI/UX/U∞ Designer from Austin, TX. I like to design it and I like to make it work beautifully. And for as many people as possible. Thanks for stopping by.This site is best viewed on a desktop.
"Designing a product is designing a relationship.” ― Steve Rogers
Prototyping
Low-fidelity/clickable wireframes and functional POCs let us talk about possibilities...
Wireframes for Project at Dun & Bradstreet - 2019
PROJECT: Master Data Analysis and Education Tool
WIREFRAMES TO REAL THING: Master Data Analysis and Education Tool


Wireframes for Project at Okta - 2021
PROJECT: Solution Engineer Portal
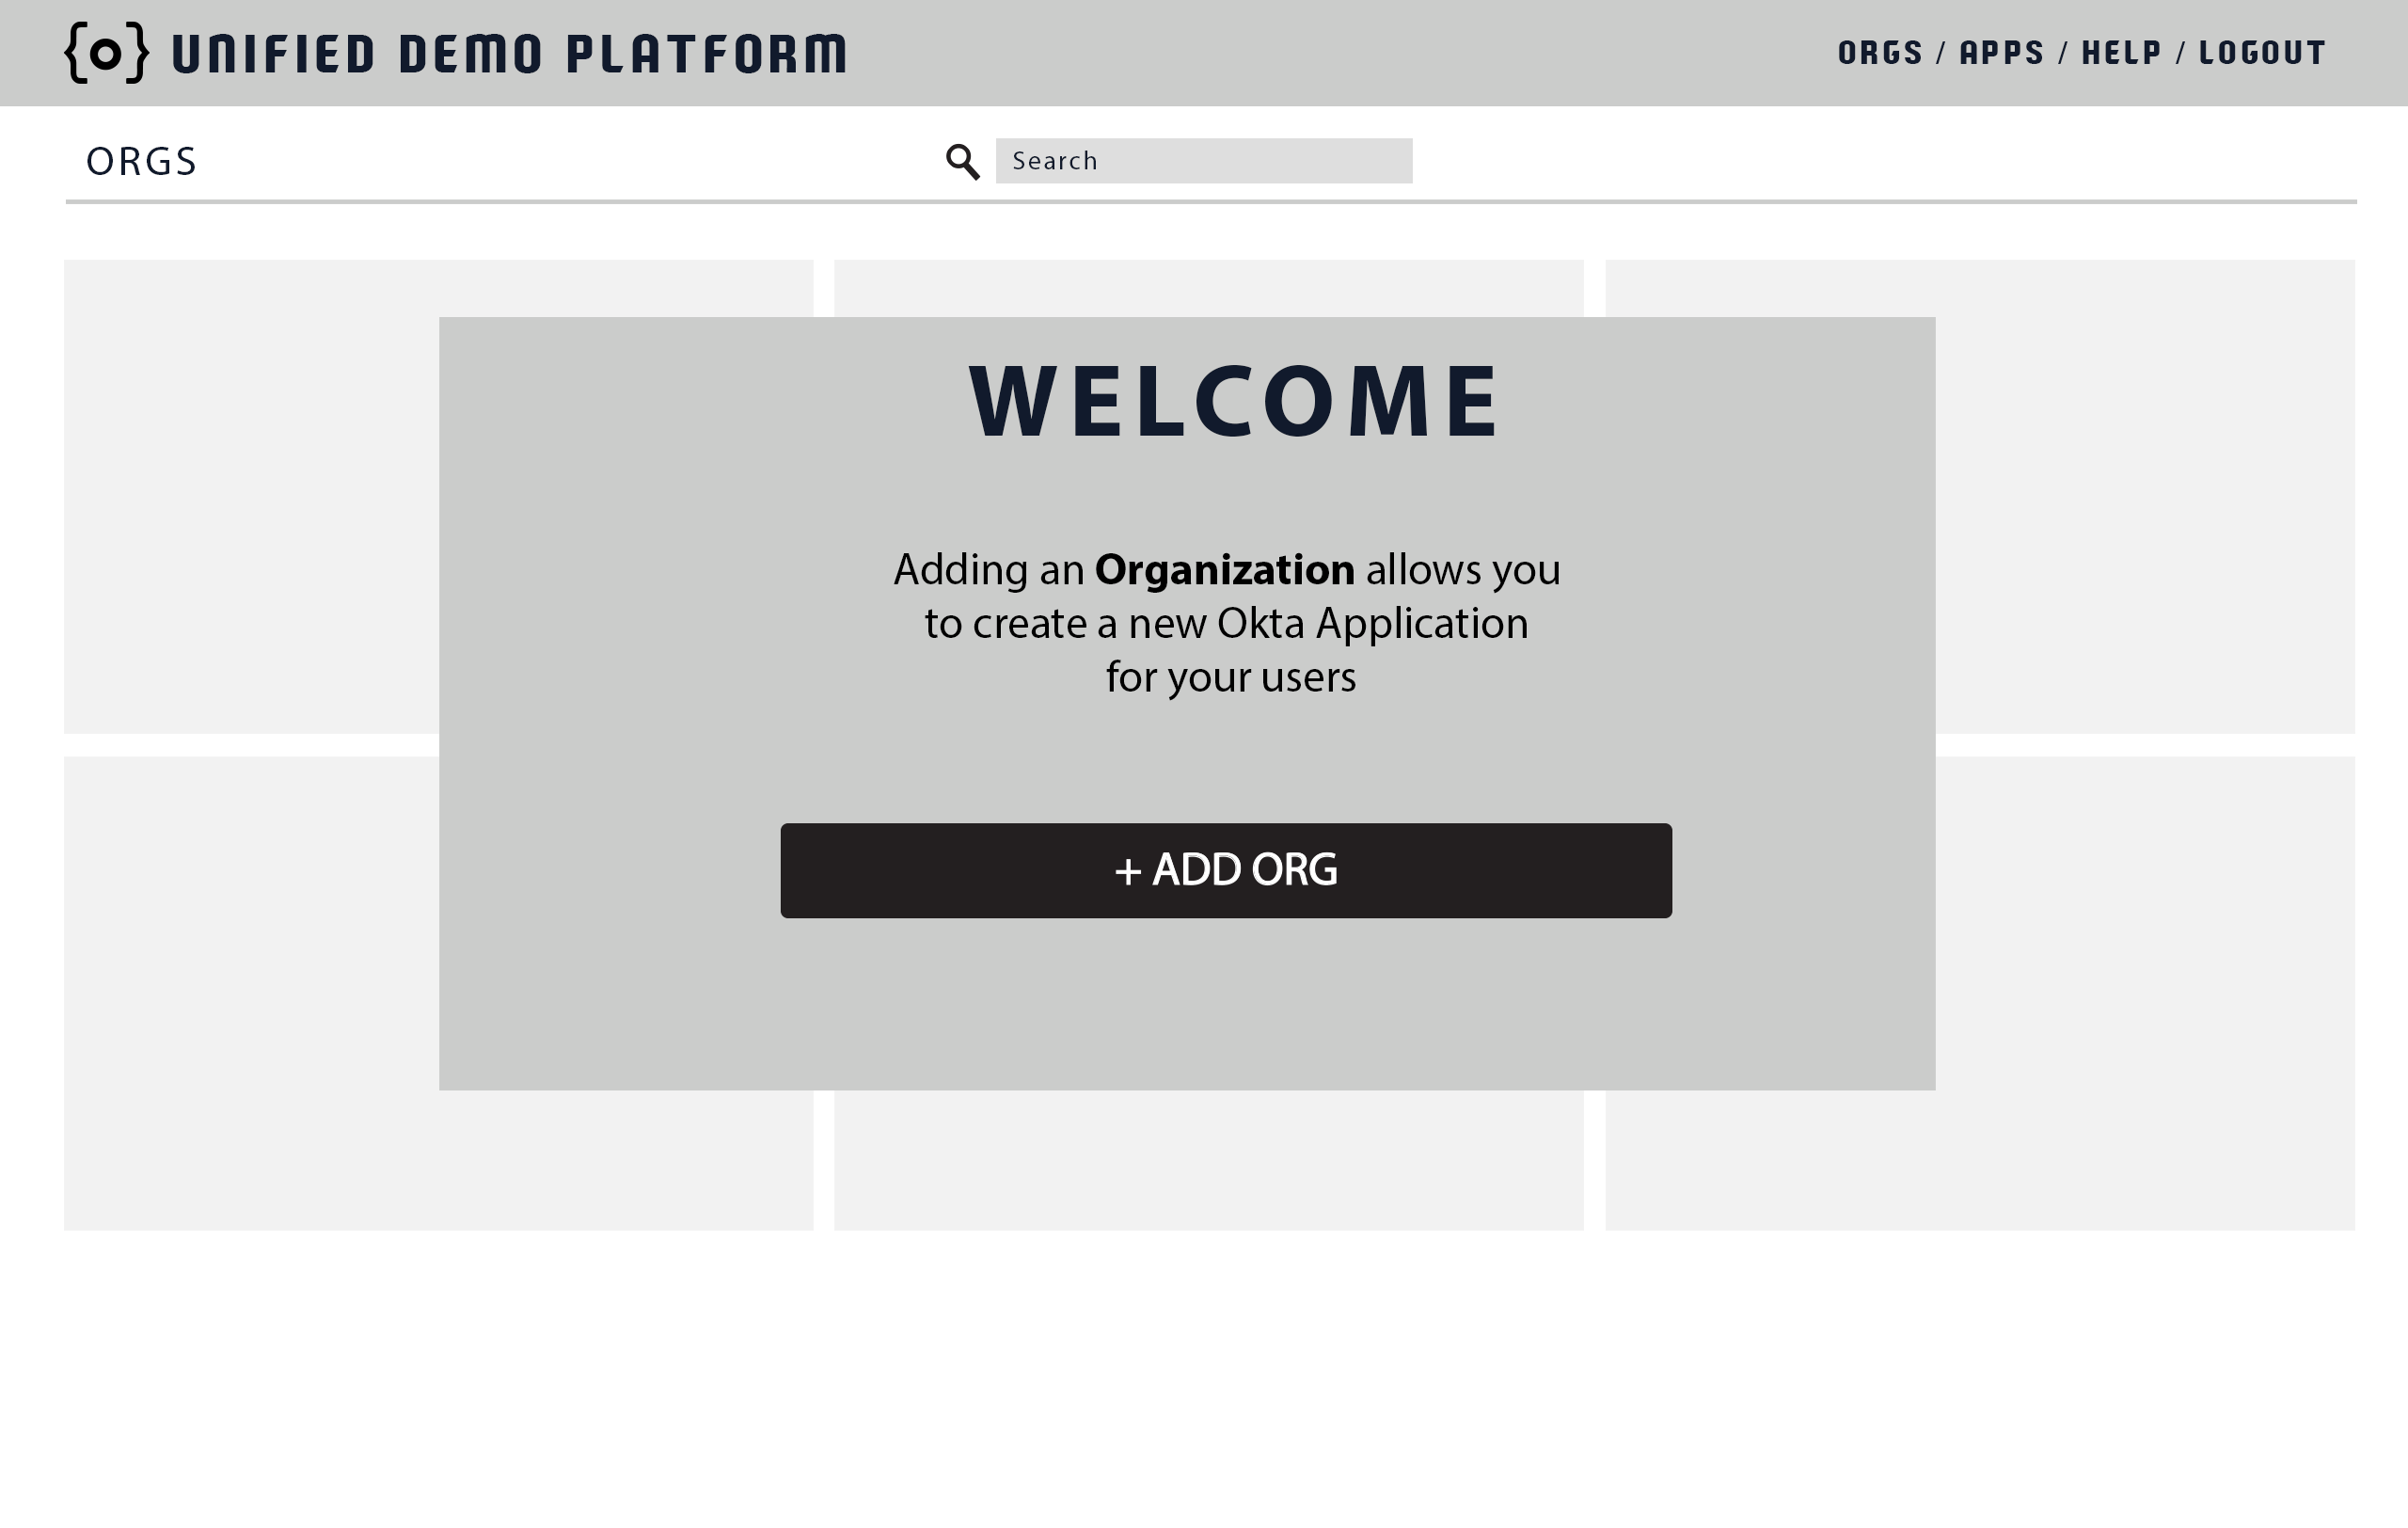
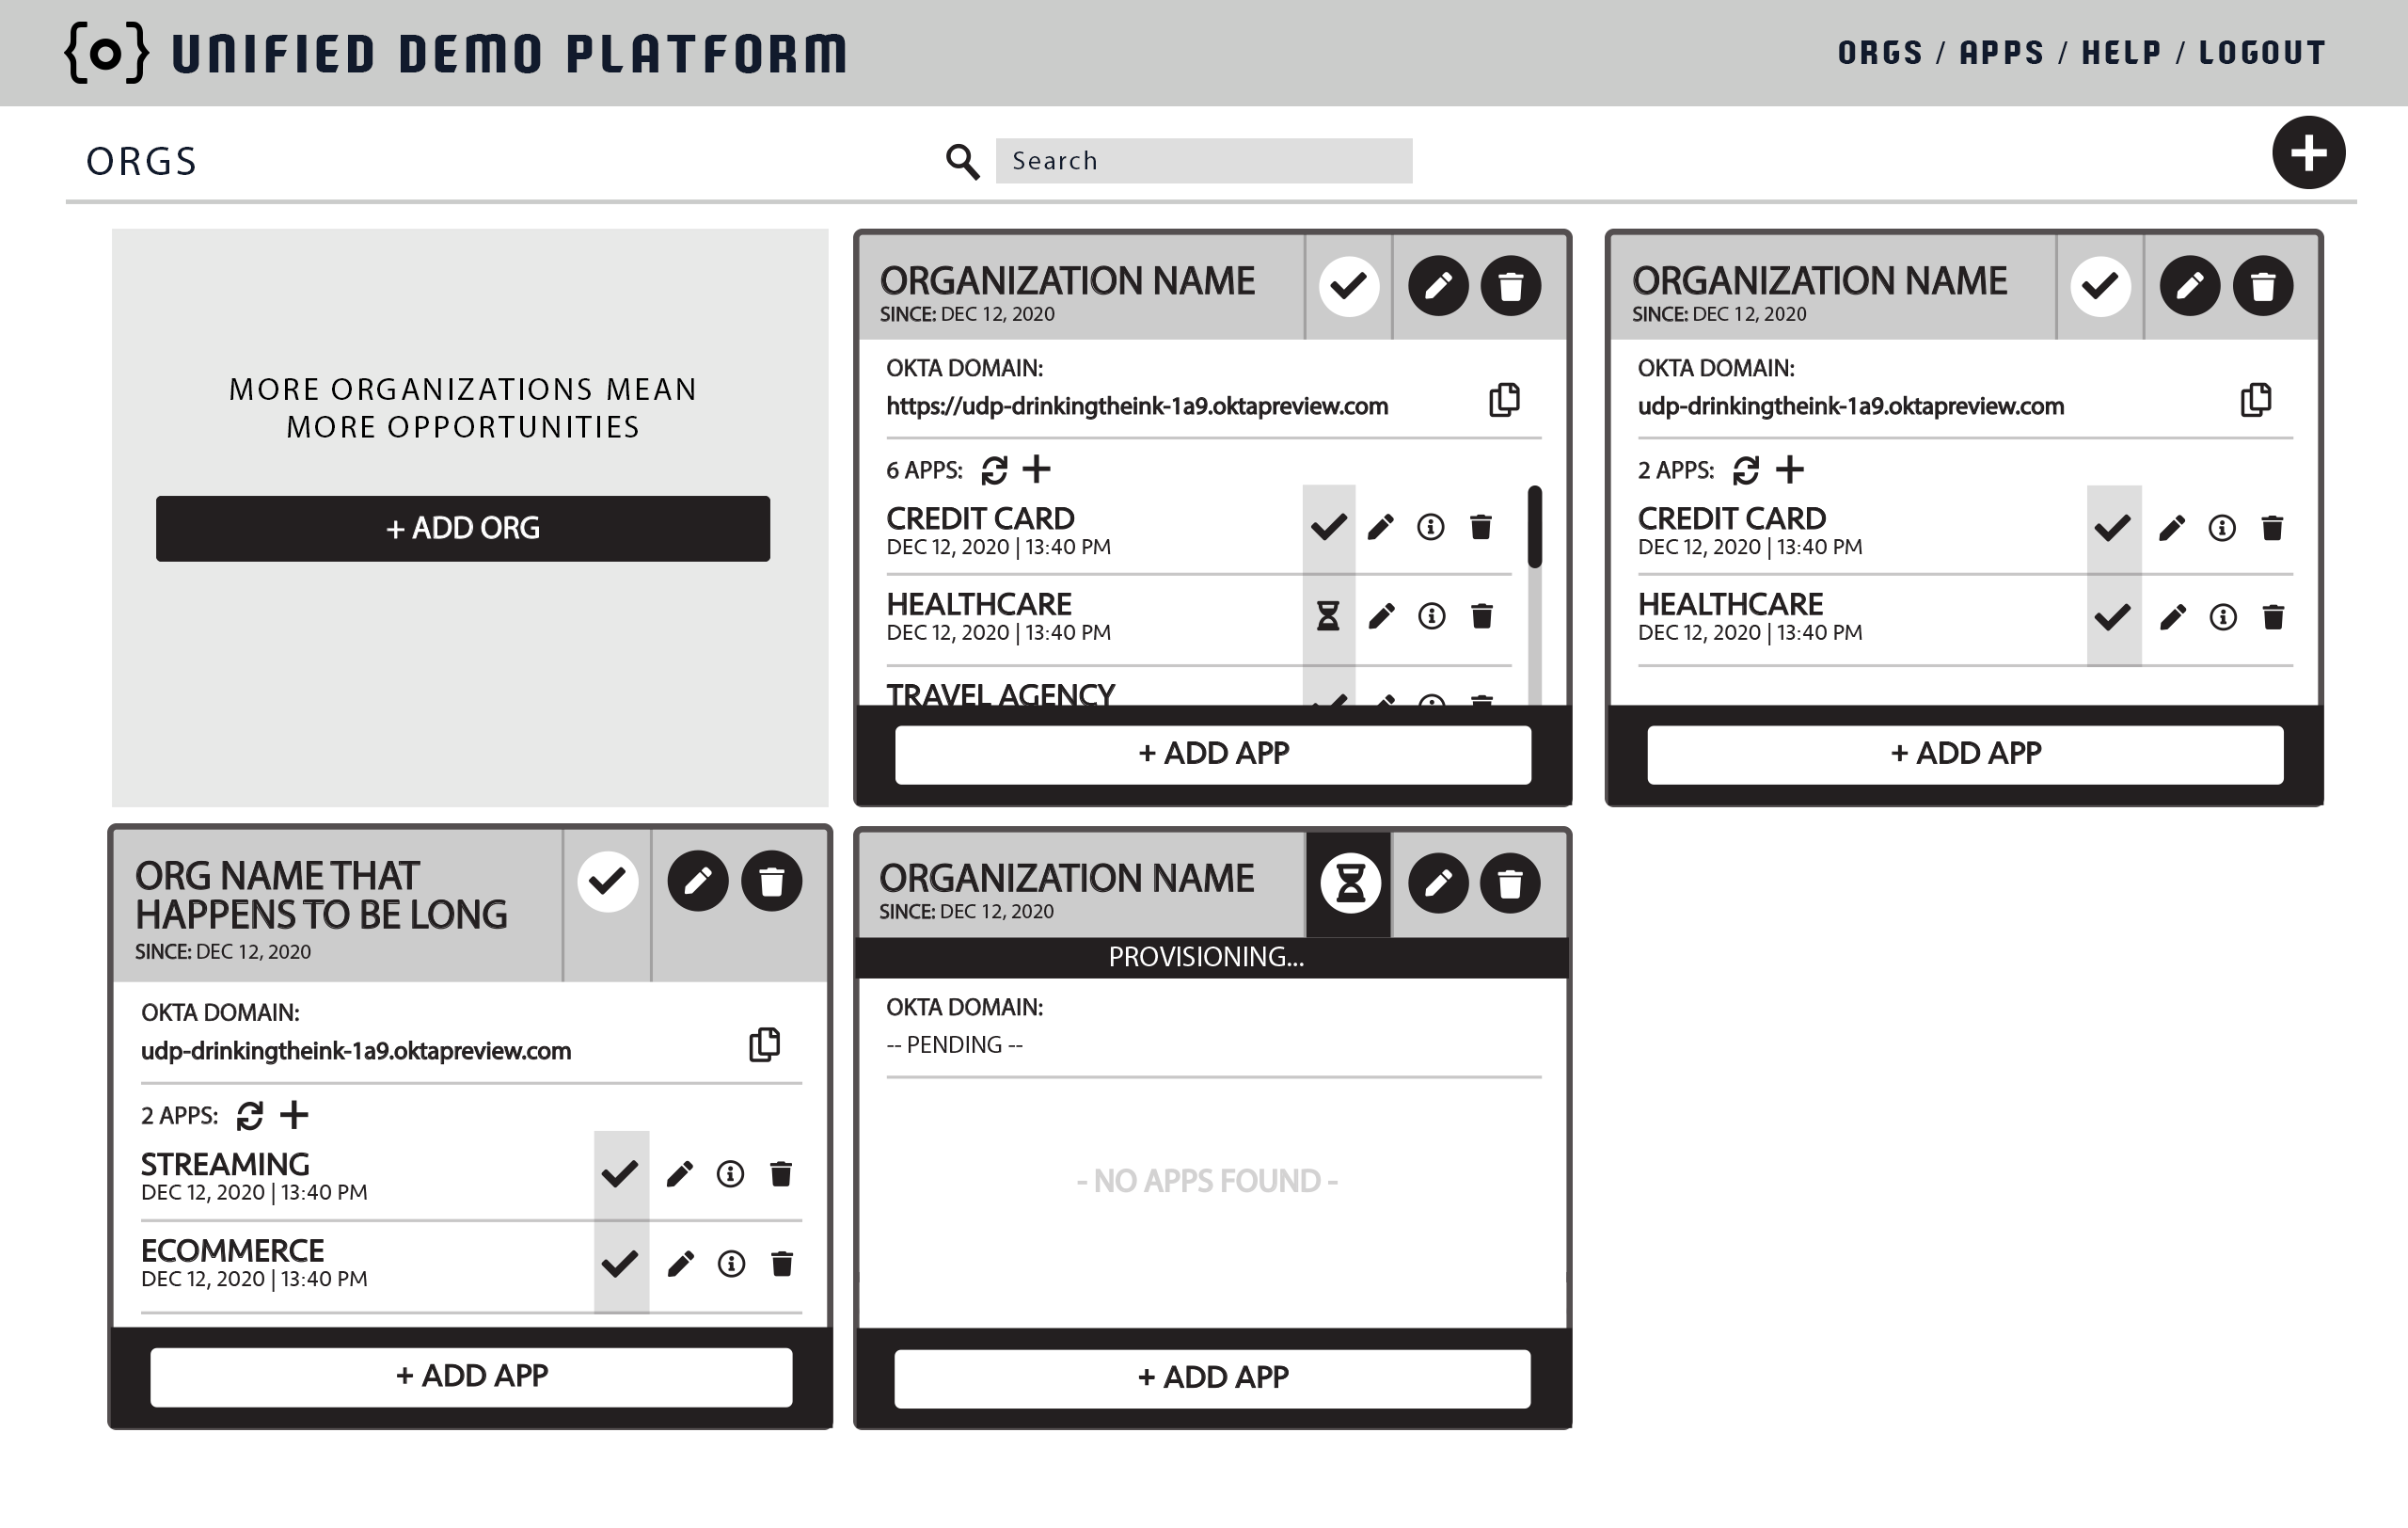
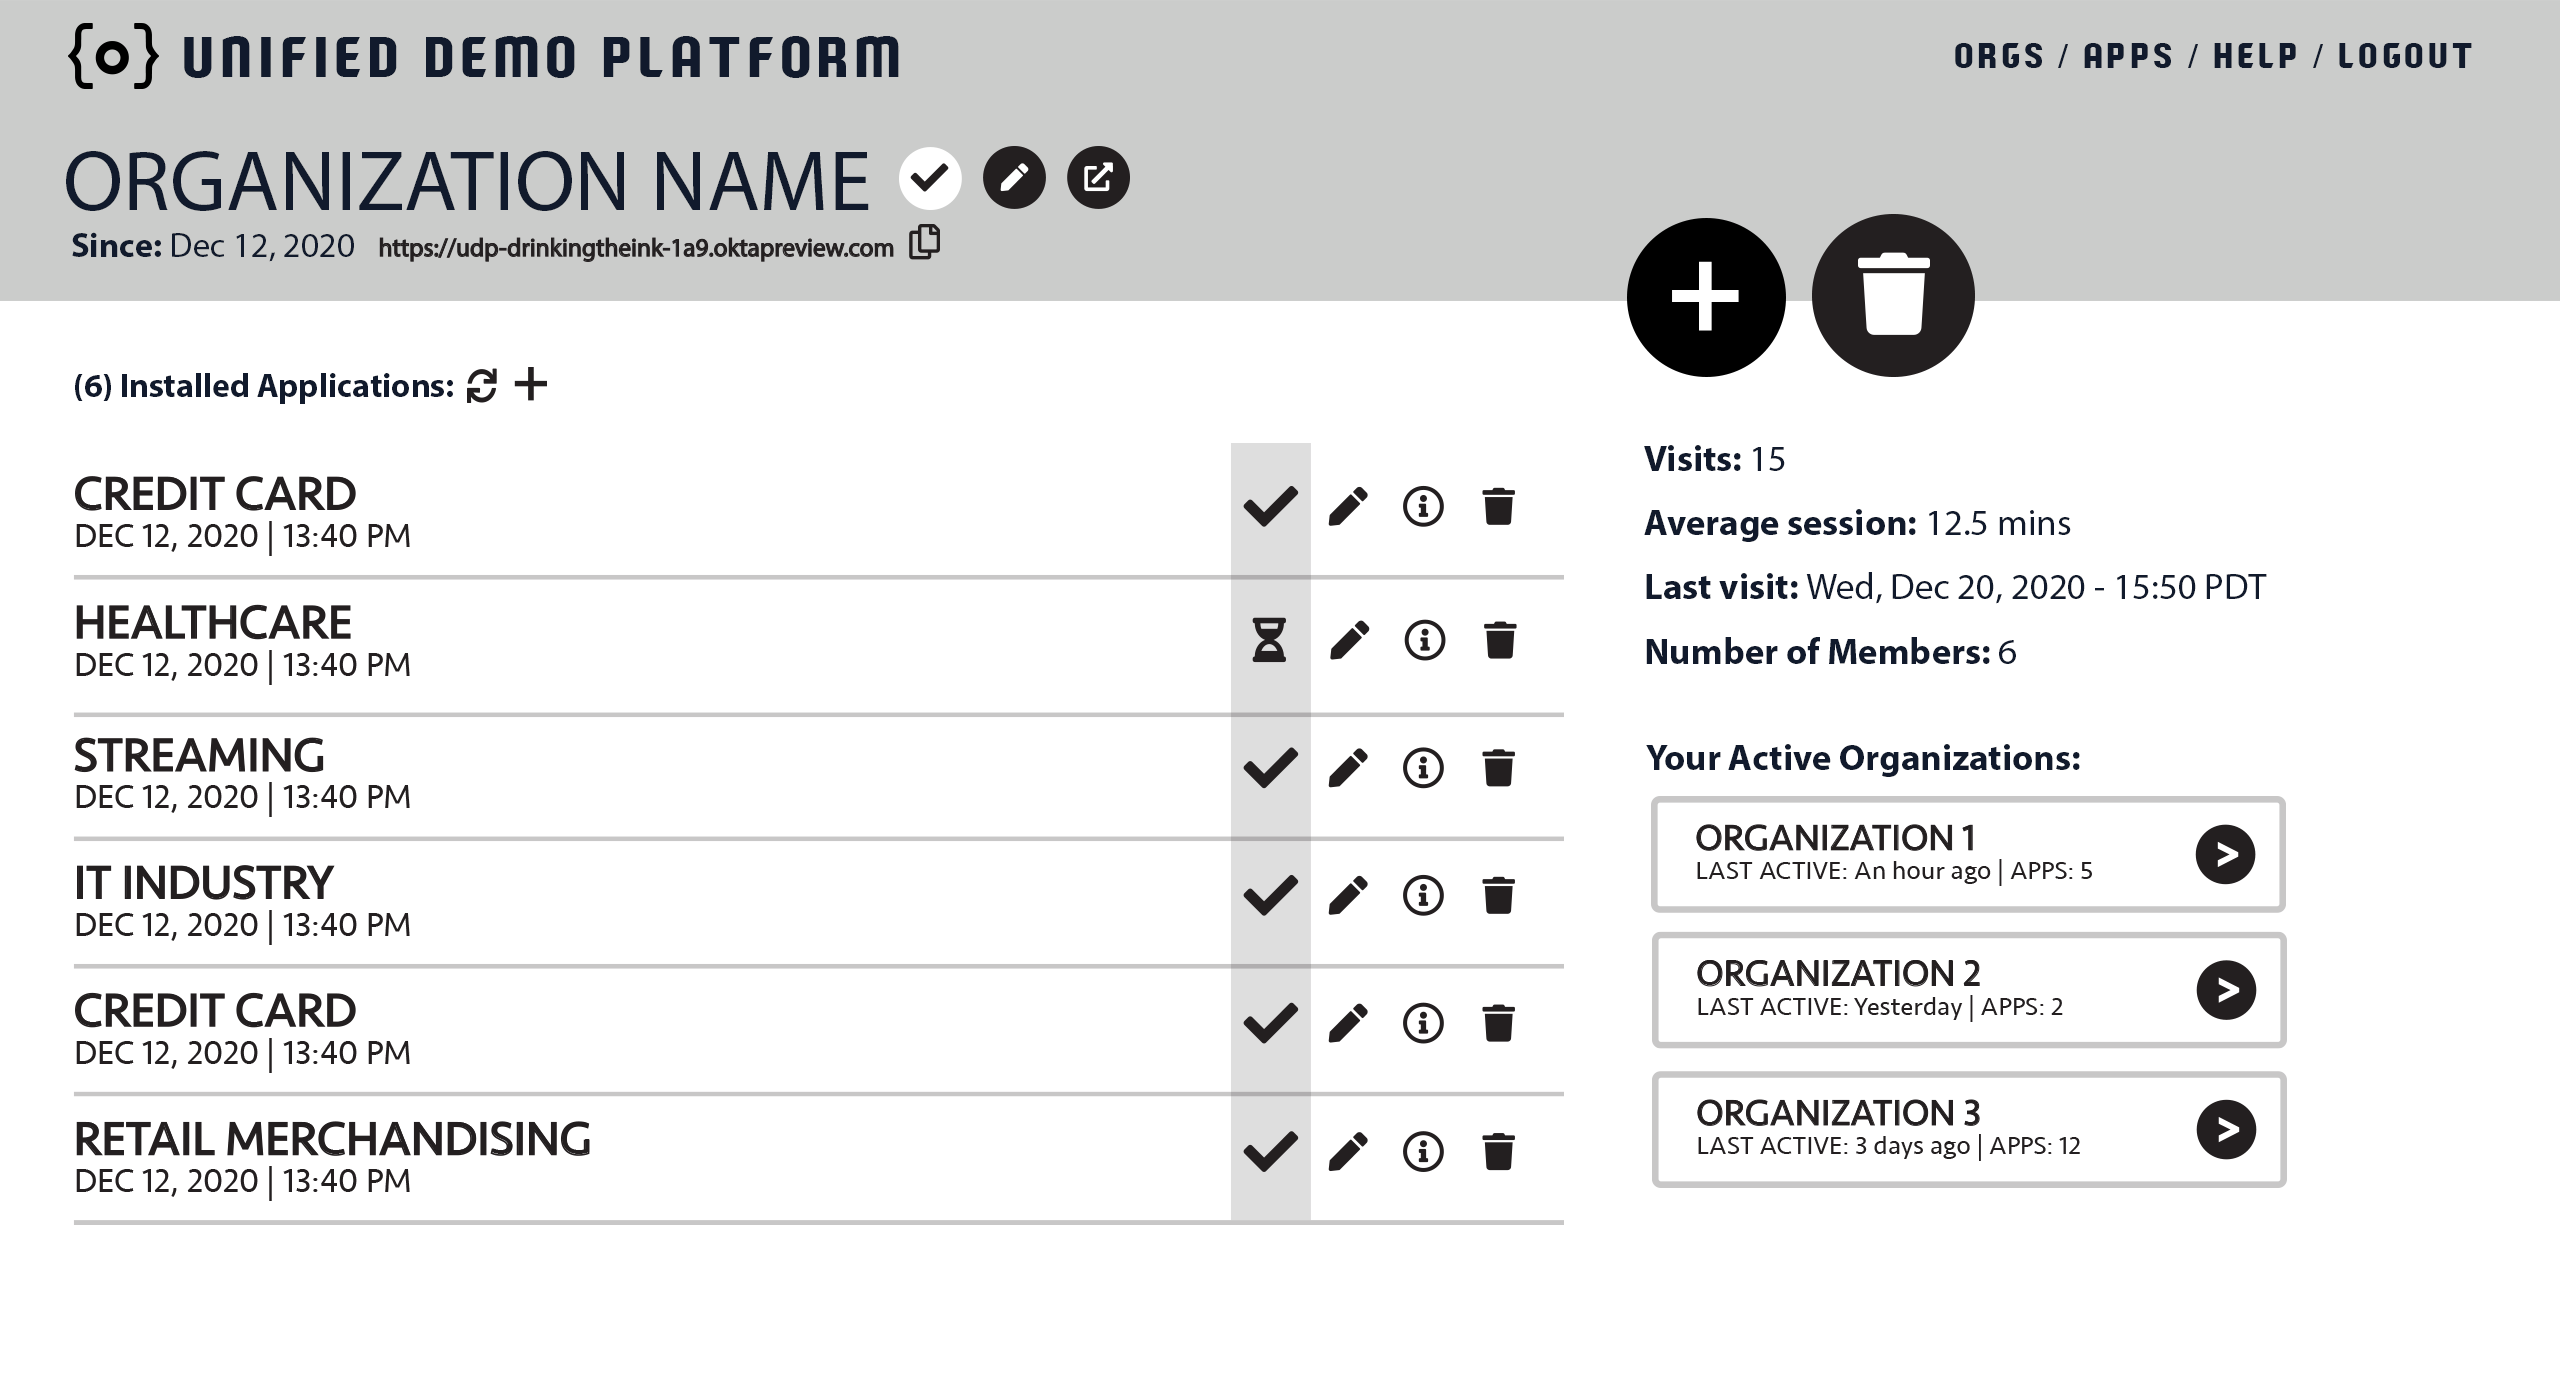
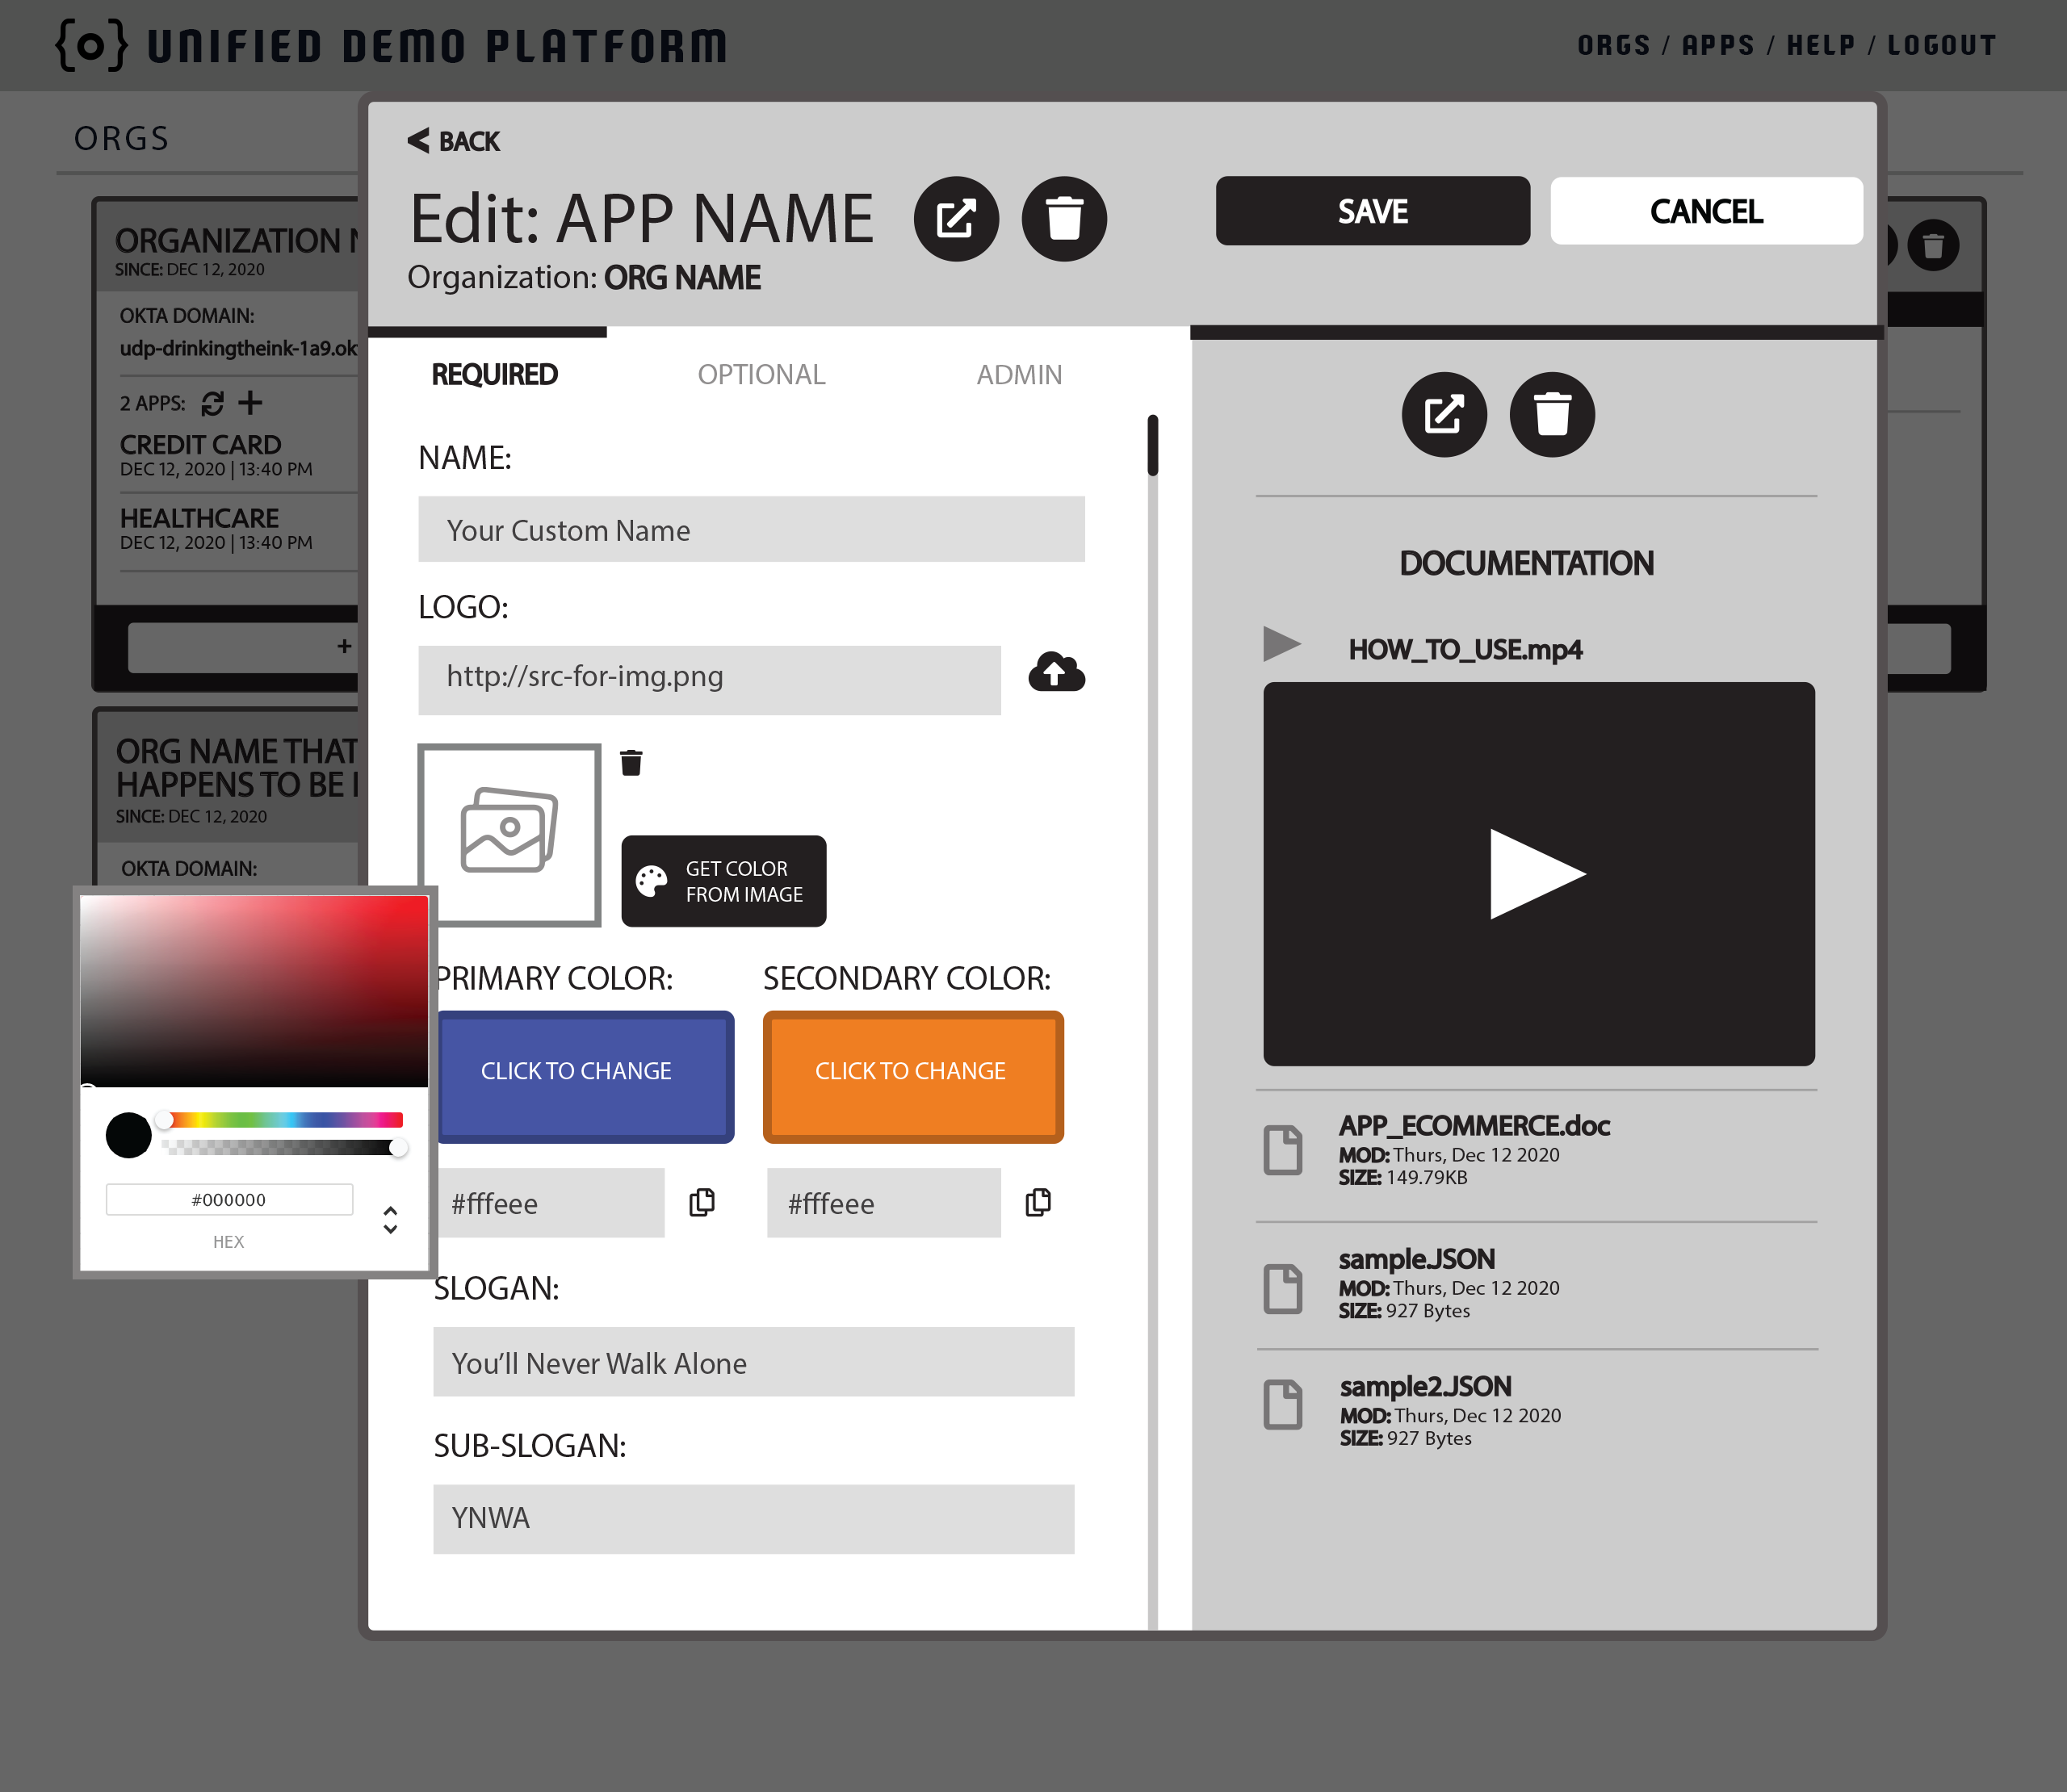
WIREFRAMES TO REAL THING: Solution Engineer Portal


Swipe Library POC at Q2 - 2021
Project: Finding the best library to use for a mobile experience
 Try It Yourself
A simple, functional app was the best way to let stakeholders quickly review different functionality sets across several swiping library options. This allowed us to select what we determined to be the best option for the project and get started on real implementation.
Background Gradient Tool at Q2 - 2020
Project: Iterating on the best end user experience
 Try It Yourself
We wanted to allow end users to build their own hero banner areas where they could add their own images and colors. I threw together this POC app with some preliminary controls that helped us decide which facets to ultimately offer in the experience.
Dashboards/Data Viz
Helping the data tell the story or show the way...
Composable Dashboard at Q2 - 2019-2023
Customizable Dashboards used by millions
This product is the combined effort of mamy teams across multiple verticals, but I was lucky enough to get to contribute heartily to the core display logic (combo of web components and custom markup), a11y, functionality (Ember and Vue Typescript repos) and styles (combo of grid and flex layouts). I helped guide this successful product from ideation to millions of users.
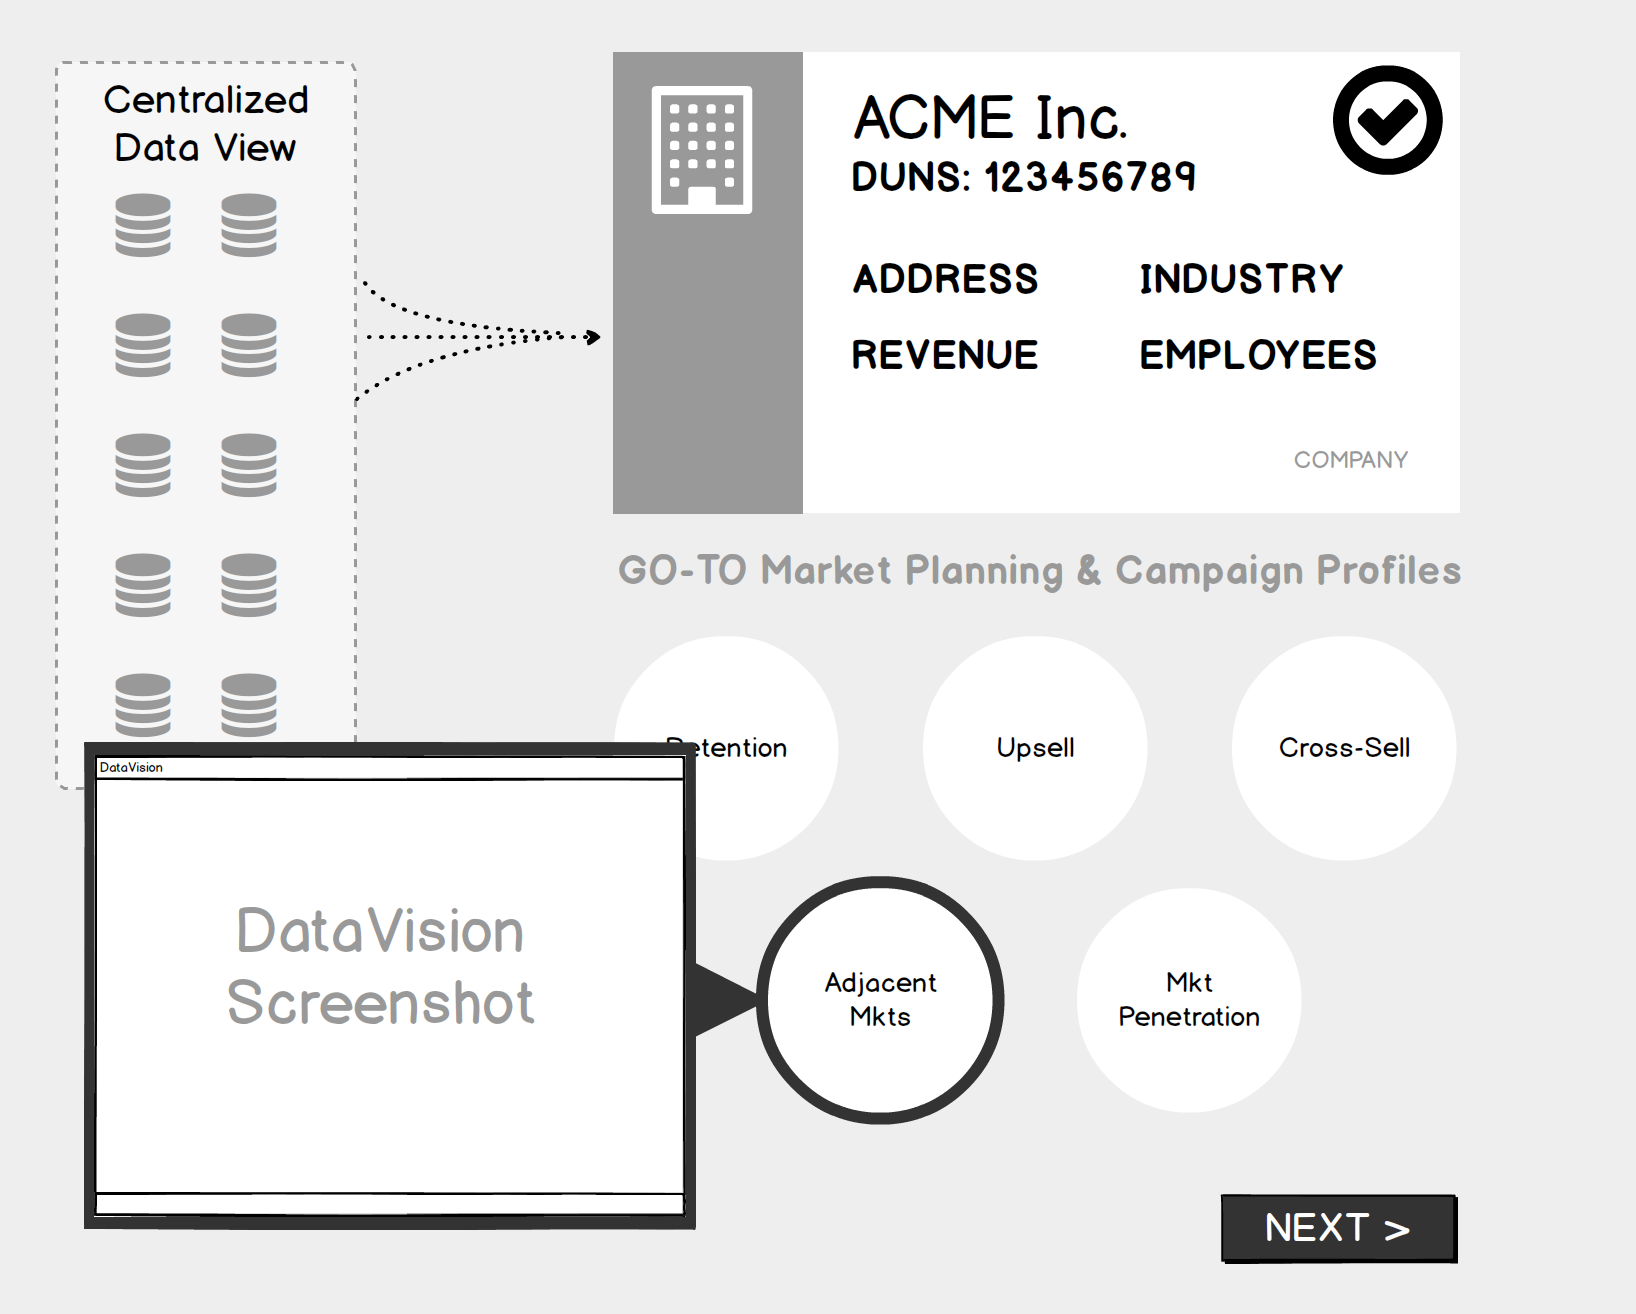
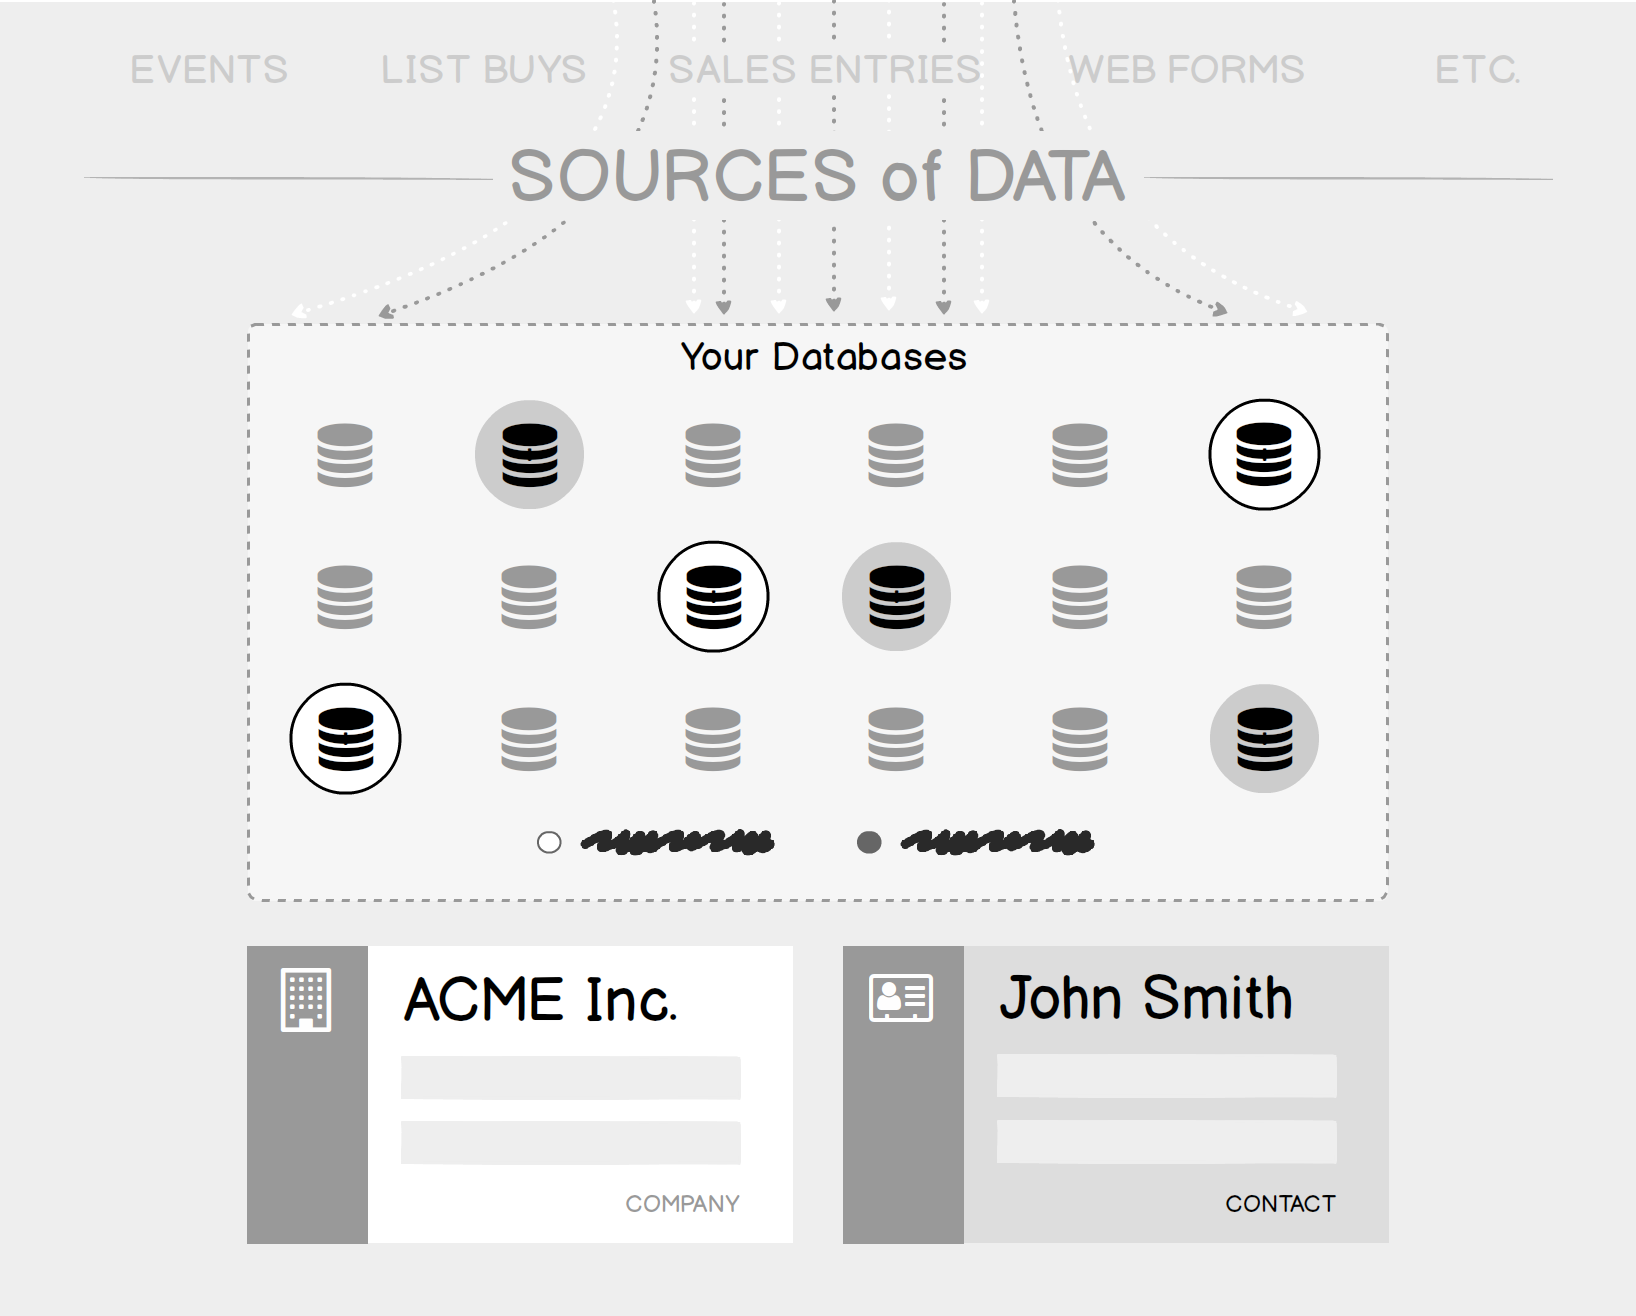
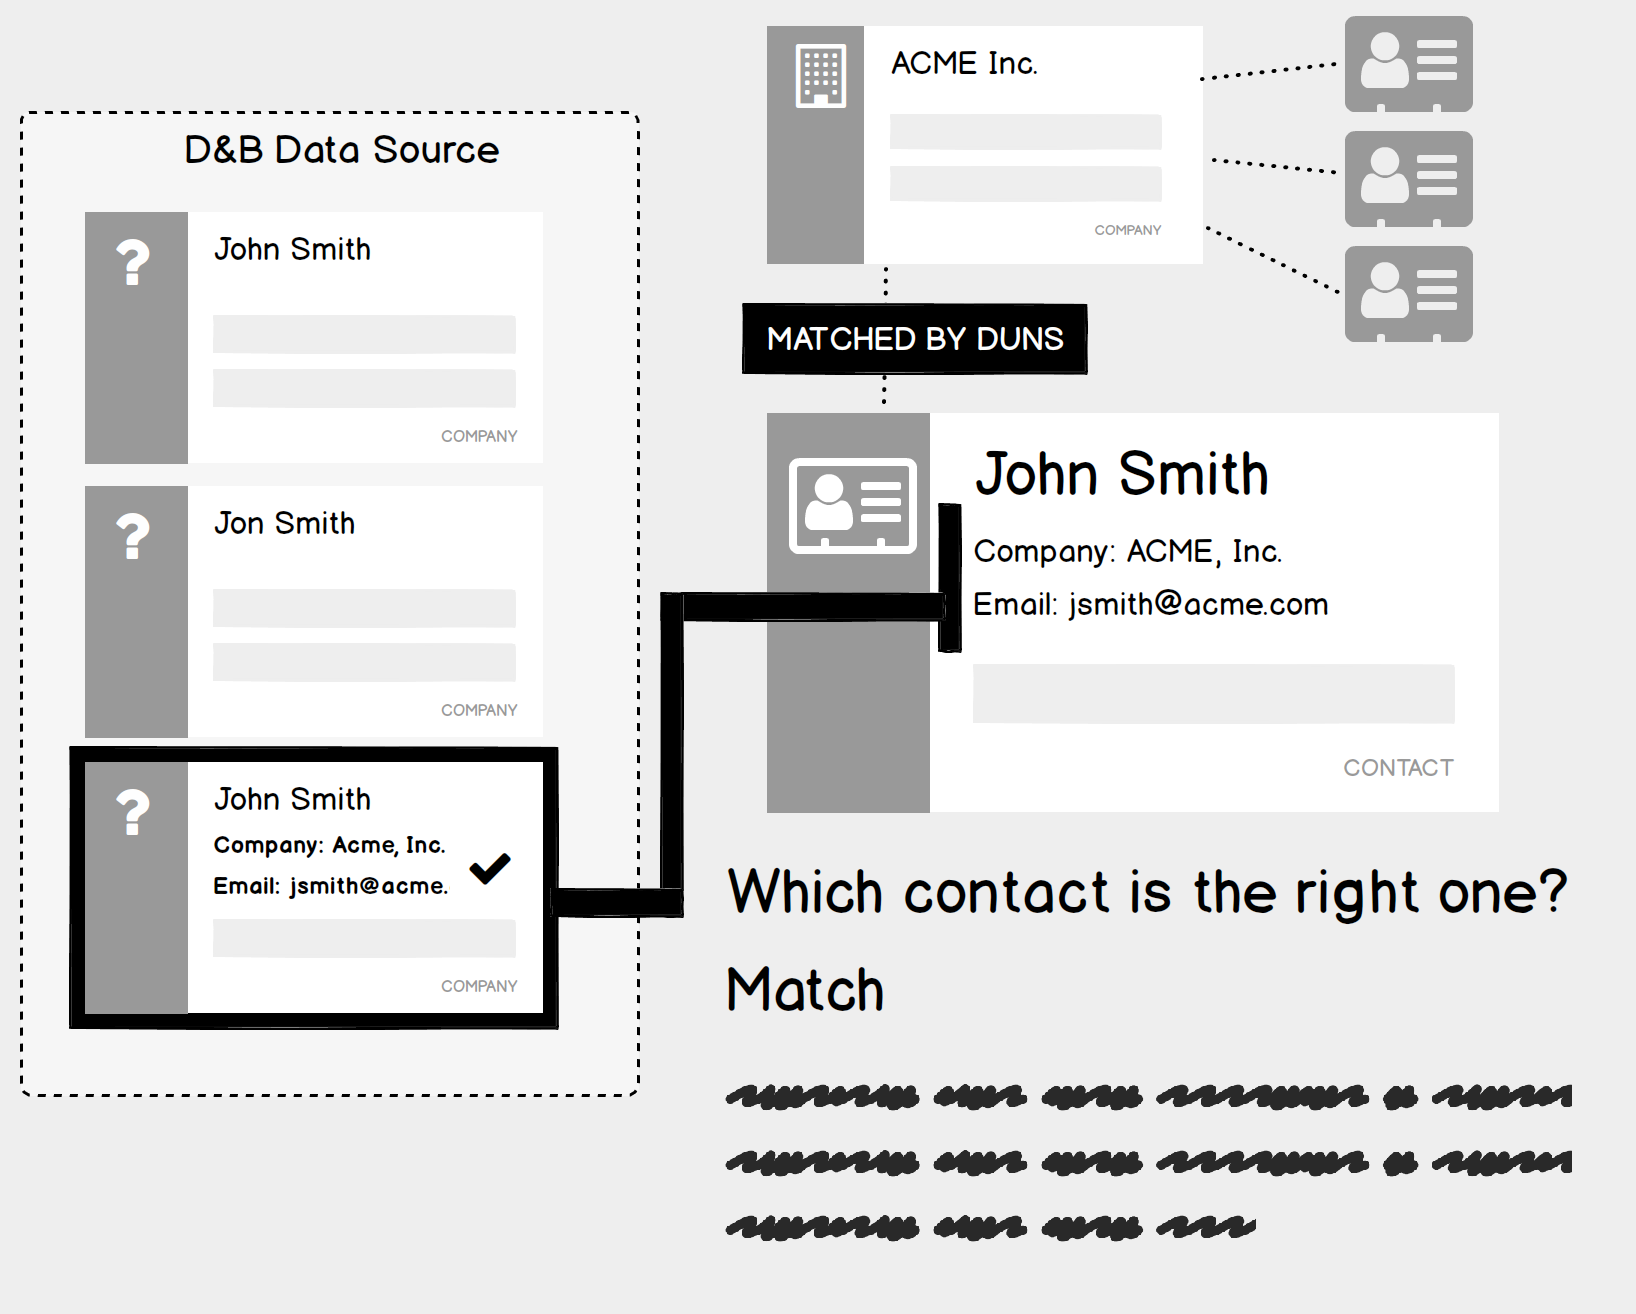
Data Optimizer at D&B - 2019
Tell the story of data's journey from compromised to actionable

I love the challenge of using the browser as a narrative vehicle. This app walks users through the lifecycle of data records; both clean and in need of maintenance. Modern CSS and SVGs make it possible to tell stories in compelling ways.
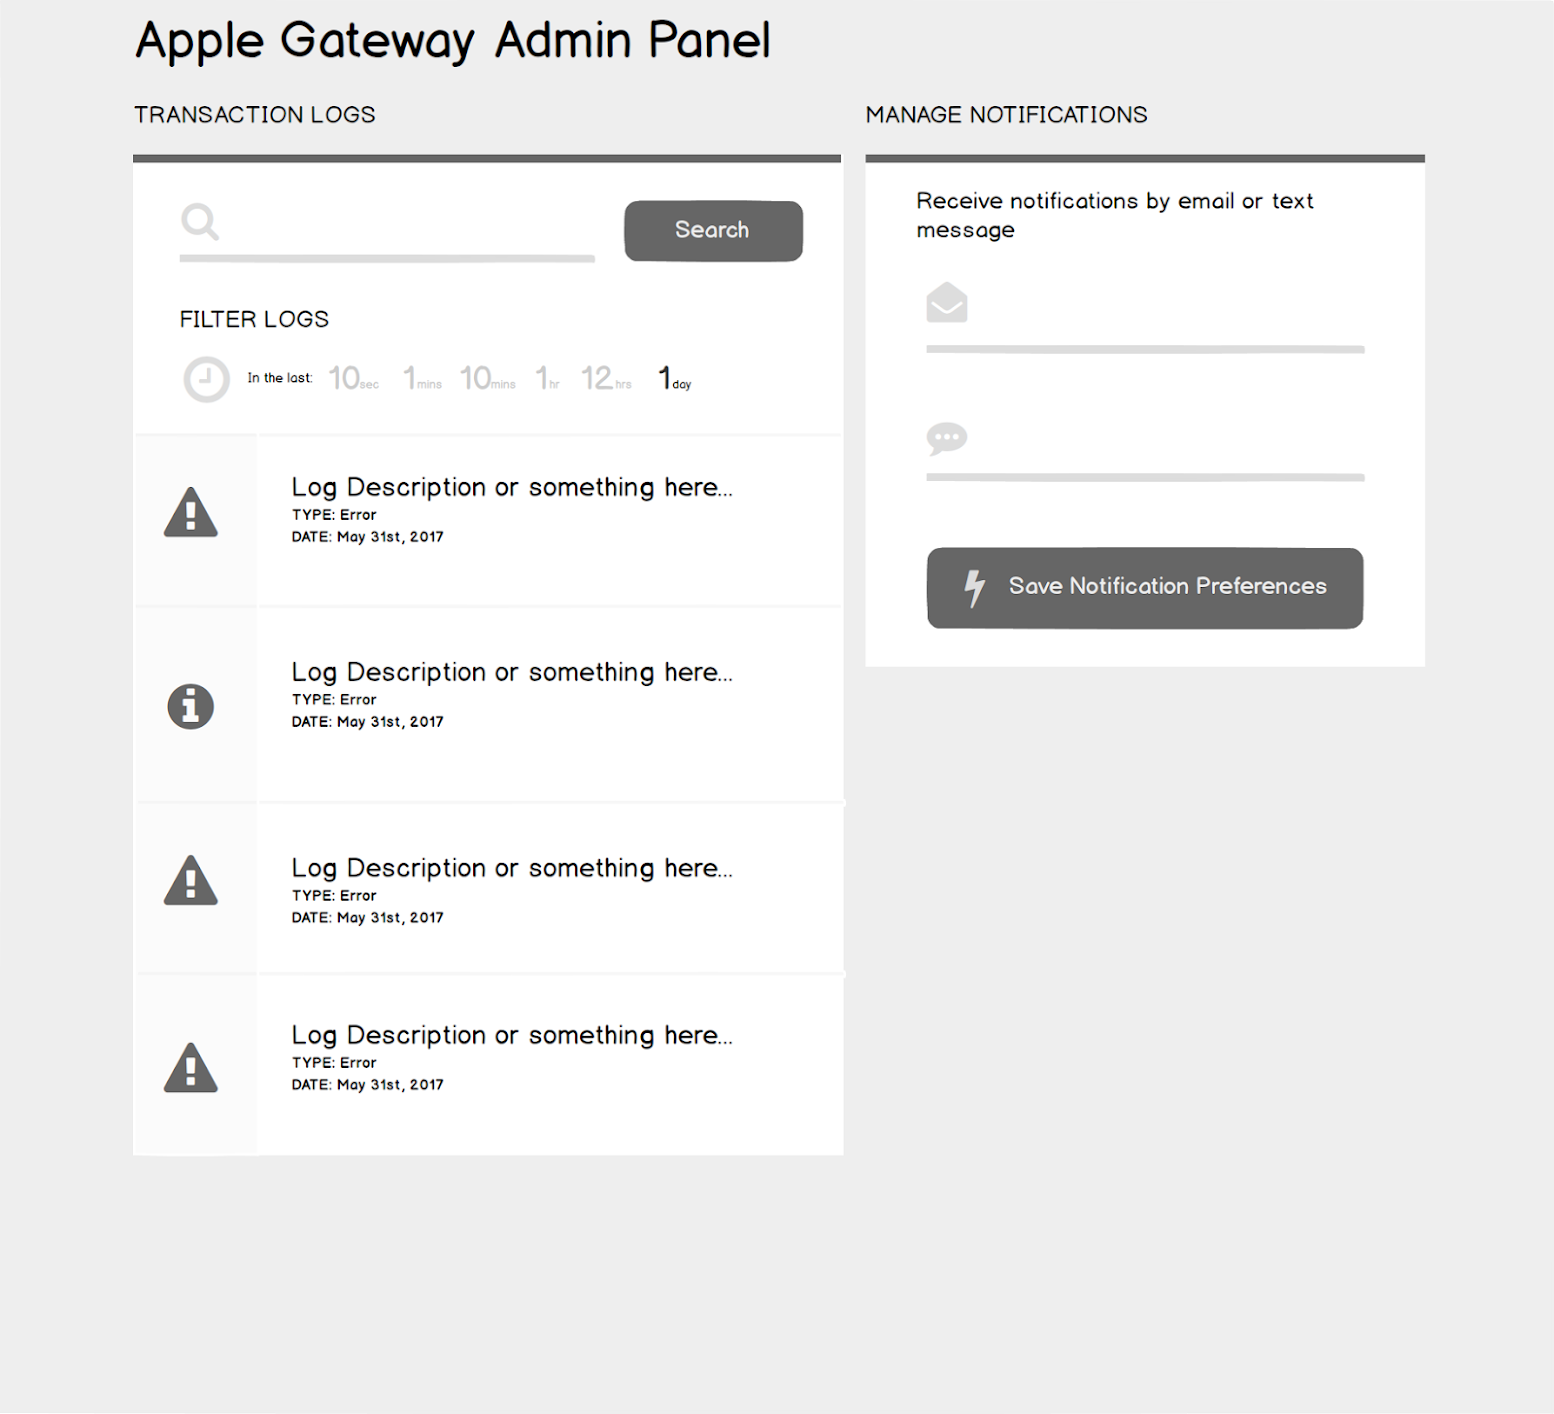
Advanced API Monitoring at D&B - 2019
Monitoring millions of API interactions daily
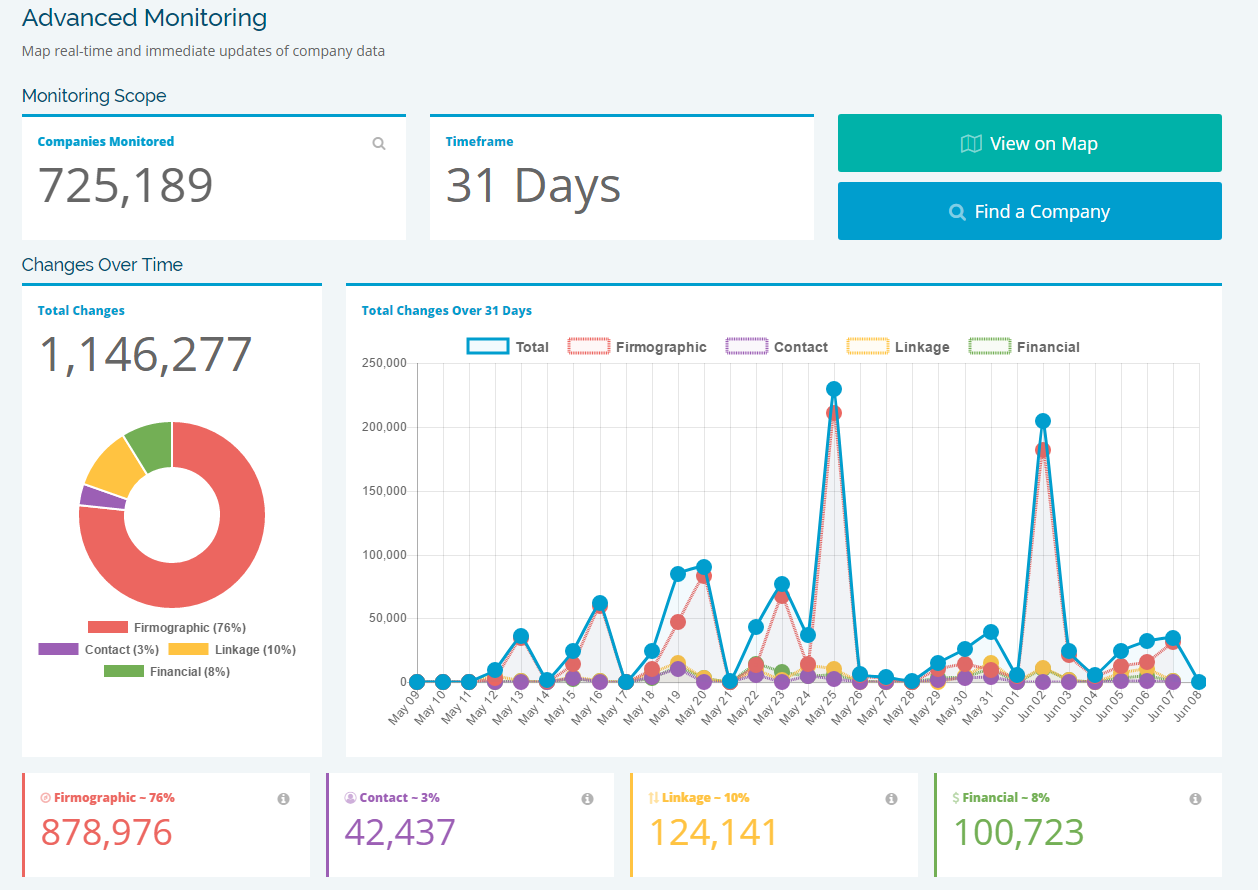
Everyday, D&B tracks millions of companies all over the world on over 250 data points per company. Advanced Monitoring allows companies to wade through this data and build their own insights on their customers and competitors.
Family Tree Explorer at D&B - 2019
Browse relationship trees within public companies

The impetus for this app was "how can we represent the many entities witin a complex company visually?" Using D&B's massive dataset, we used opacity to give a sense of depth and spacial positioning.
Company Location Plotter at D&B - 2019
Mapping the locations of public company entities

Another app based on the question: "how can we represent the many entities witin a complex company visually?" This app plots company HQs on a map to help provide context through physical locations.
Data Maturity Matrix at D&B - 2018
Visualizing the state of a customer's Master Data Management Program

This app helps users diagnose their own Master Data Management Program efficiency and get feedback on performance and insight through a series of questions. A few different charts help users understand their MDM Program in greater detail.
Design Systems
Built-in consistent branding and functionality...
Carousel Element at Q2 - 2019-2023
Accessible Carousel Element for the Tecton Design System
 Try It Yourself
Can one build a truly accessible carousel? Probably not since by definition some content is hidden. But our customers demanded it and we gave it our best shot.
Animation Standards via Tecton at Q2 - 2022
Allowing developers to integrate consistent motion in their UIs
 Try It Yourself
We wanted to modernize our UI by adding motion, but we wanted to avoid ad hoc animations across different teams. To maintain quality and consistency, we introduced animation standards via our Tecton Design System.
Illustration Library Branding at Q2 - 2022
Allowing users to configure their own branded illustrations
In allowing Financial Institutions to white label their own Online Banking experience, we increased their ability to distinguish themselves in their market with vector illustrations they could configure on their own to stand out or blend into their UIs.
Other contributions to the Tecton Design System
- Contributed to the color system to expand useful accent colors
- Contributed to core features enabling third-party developers to create responsive experiences via our SDK
- Wrote documentation on how to create content blocks for display in our Composable Dashboard